INP on Media-Heavy Sites: Debugging Interaction Latency with LoAF and scheduler.yield()
Video galleries, synthetic media portfolios, and image sliders have a unique INP profile that generic advice doesn't address. Here's how to debug interaction latency with the modern APIs that actually work.
INP on Media-Heavy Sites: Debugging Interaction Latency with LoAF and scheduler.yield()
43% of websites still fail the 200ms INP threshold — that's the widely quoted CrUX statistic for 2026. But some sites have it worse than others: media-heavy sites. Video galleries, synthetic media portfolios, 4K image sliders, parallax scroll animations, embedded players. Every media component adds scripts, event handlers, and rendering work that spike INP in ways a text-based blog never experiences.
Most INP advice is generic: "lazy-load your scripts" and "break up long tasks." But what about when the long tasks are your product? When the slider and the video player and the parallax library are the core experience?
This article walks through the debugging workflow we use at Mintec — real field data, not Lighthouse — using the Long Animation Frames (LoAF) API and scheduler.yield() to find and fix INP in media-heavy production sites.
Why Media-Heavy Sites Have a Different INP Profile
On a typical editorial site, INP offenders are analytics scripts, a chat widget, or a newsletter form. On a media site, the profile is completely different:
| Media Component | Typical INP Impact | Reason |
|---|---|---|
| Video player (YouTube, Vimeo, custom) | +150–400ms | Player scripts, bandwidth detection, quality negotiation |
| Image gallery / masonry layout | +100–300ms | Layout calculation, conditional lazy loading, transition animations |
| Touch slider / carousel | +80–250ms | Touch/scroll handlers, position calculations, expensive CSS transitions |
| Parallax scroll (Lenis, GSAP ScrollTrigger) | +60–200ms | Continuous position updates on every scroll frame |
| Synthetic media (AI video, 3D avatar) | +200–500ms | Heavy renderer scripts, video buffers, real-time processing |
What these have in common: they process significant work on the main thread exactly when the user is interacting. And since INP measures the worst interaction across the entire page lifecycle, a single 300ms slider lag can tank your score even if the rest of the page is fast.
The Real Case: Our Luxury Brand Portal
The project where we learned the most about media-site INP was a luxury brand portal with 4K image galleries and a full-screen autoplay video hero. The initial data was sobering:
| Before | After |
|---|---|
| INP: 340ms (p75 on CrUX) | INP: 98ms |
| LCP: 6.2s (with video) | LCP: 1.2s (with poster + Server Island) |
| Lighthouse Performance: 72 | Lighthouse Performance: 99 |
We brought INP from 340ms down to 98ms using three techniques — but before applying any fix, we needed to know exactly what was causing the latency. That's where LoAF and scheduler.yield() come in.
Step 1: Diagnose with the Long Animation Frames (LoAF) API
The Long Animation Frames API — stable in Chrome since v123 and now available across all major browsers — is the most precise tool for INP diagnosis. Whenever the browser takes longer than 50ms to paint a frame, LoAF captures exactly which scripts were involved, how long they ran, and how much they blocked the main thread.
Here's how we set up a production observer to collect field data:
const loafObserver = new PerformanceObserver((list) => {
  const entries = list.getEntries();
  for (const entry of entries) {
    if (entry.duration < 50) continue;

    // Per-script attribution: identify the exact offender
    for (const script of entry.scripts) {
      console.log({
        sourceURL: script.sourceURL,
        sourceFunctionName: script.sourceFunctionName,
        duration: script.duration,
        startTime: script.startTime,
        execStartTime: script.execStartTime,
      });
    }

    // Aggregate frame data
    console.log({
      duration: entry.duration,
      blockingDuration: entry.blockingDuration,
      firstUIEventTimestamp: entry.firstUIEventTimestamp,
      renderStart: entry.renderStart,
    });
  }
});

loafObserver.observe({ type: 'long-animation-frame', buffered: true });
On our luxury project, this revealed something Lighthouse never showed: the third-party video player was running a bandwidth detection script every time the user interacted with the gallery, blocking the main thread for ~180ms per interaction. Without LoAF, we would have optimized the wrong components.
What LoAF Taught Us About Media Scripts
Across our audits, the most common patterns LoAF exposed on media-heavy sites were:
- Video players re-negotiating quality on every interaction — each time the user touches a slider, the player re-evaluates stream resolution
- Parallax libraries computing position on every scroll frame — continuous DOM updates creating long frames
- Galleries pre-processing images outside the viewport — preload logic competing with user interactions for main thread time
- Media analytics pinging on every playback event — GA4 and tracking systems saturating the main thread
Before LoAF, debugging media-site INP was trial and error. Now it's measure-and-act.
Step 2: scheduler.yield() — Break Up Long Tasks Without the setTimeout Penalty
Once you've identified the problematic scripts, the most effective fix is usually breaking long tasks into smaller chunks so the browser can handle interactions between them.
scheduler.yield() — available in Chrome 129+, Edge 129+, and Firefox 142+ — lets you voluntarily pause a task and resume when the browser has capacity, without the 4ms clamped delay that setTimeout(0) imposes. This means shorter interruption gaps and better INP.
Production implementation with Safari fallback (2026)
async function yieldToMainThread() {
  // scheduler.yield() is the modern, fast option
  if ('scheduler' in window && 'yield' in scheduler) {
    await scheduler.yield();
    return;
  }
  // Safari fallback: MessageChannel avoids the setTimeout clamp
  if (typeof MessageChannel !== 'undefined') {
    return new Promise((resolve) => {
      const channel = new MessageChannel();
      channel.port2.onmessage = resolve;
      channel.port1.postMessage(undefined);
    });
  }
  // Last resort: setTimeout(0) with 4ms clamp
  return new Promise((resolve) => setTimeout(resolve, 0));
}
On the luxury portal, we applied this pattern in three critical places:
Progressive gallery loading:
async function loadGalleryImages(images) {
  for (let i = 0; i < images.length; i++) {
    const img = new Image();
    img.src = images[i].url;
    document.querySelector('#gallery').appendChild(img);

    // Yield every 4 images to keep the main thread free
    if (i % 4 === 0) await yieldToMainThread();
  }
}
Video player bandwidth detection:
async function checkBandwidthAndAdjust() {
  const measurements = await measureNetworkSpeed(); // long task
  await yieldToMainThread(); // yield before touching the DOM
  adjustVideoQuality(measurements); // DOM manipulation
}
Parallax scroll updates:
// Instead of updating on every requestAnimationFrame
let pendingUpdate = false;
window.addEventListener('scroll', () => {
  if (pendingUpdate) return;
  pendingUpdate = true;

  requestAnimationFrame(async () => {
    await yieldToMainThread();
    updateParallaxPositions();
    pendingUpdate = false;
  });
});
The Measured Impact
After implementing scheduler.yield() across all three components, INP dropped from 340ms to 140ms — a 59% improvement. Combined with Server Islands for the hero video (reducing the player's initial load), we reached the final 98ms.
| Technique | INP Reduction | Effort |
|---|---|---|
| LoAF diagnostics + scheduler.yield() in gallery | -120ms | 1 day |
| Server Island for hero video | -80ms | 2 days |
| Conditional lazy loading of third-party scripts | -42ms | 1 day |
Step 3: Server Islands and Content Architecture
The third part of the fix is architectural: if your media site loads heavy scripts on every page, you're giving away performance for free. Astro's Server Islands pattern — which we've applied across three production projects this year — lets you defer interactive components without blocking initial render.
On our luxury portal, we moved the video player to a Server Island. The static HTML shell serves a 12KB AVIF poster frame, and the full player (with all its scripts) loads only when the user scrolls to it. Result: the base page INP dropped from 340ms to 98ms because the player no longer blocked the main thread during initial interactions.
We've covered Server Islands vs PPR for content sites and the hero video dilemma in depth — both are complementary reads if you're migrating toward this architecture.
Decision Framework: INP Debugging by Media Site Type
| Site Type | Diagnosis Priority | Most Useful API | Expected Primary Fix |
|---|---|---|---|
| Video portfolio / showreel | Player scripts, bandwidth detection | LoAF | Server Island + scheduler.yield() in player |
| E-commerce with product zoom & slider | Touch handlers, position calculations | LoAF + Event Timing API | yieldToMainThread in handlers |
| Brand portal with parallax & scroll | Continuous scroll updates | LoAF + Performance Observer | Debounce + yield in scroll handlers |
| Synthetic media (AI video, 3D) | Renderer scripts, video buffers | LoAF + Long Tasks API | Web Workers for background processing |
| Blog with embedded video | Third-party player blocking | LoAF | Conditional lazy load + poster first |
The Complete INP Debugging Workflow We Use at Mintec
If you're starting INP optimization on your media-heavy site, this is the order we follow:
- Measure with real data — Query the CrUX API or implement RUM (SpeedVitals, Request Metrics). Don't trust Lighthouse for INP.
- Capture LoAF in production — Deploy the observer above on your problem page. Run the most common interactions (gallery click, scroll, touch).
- Identify the guilty script — Check
entry.scripts[0].sourceURLin the LoAF output. That's your target. - Apply scheduler.yield() — Break the long task into chunks. If the script is third-party and you can't modify it, consider conditional loading or an isolated iframe.
- Measure again — Verify the improvement with field data, not just lab tests.
For a broader analysis of INP in 2026 — including the classic causes (third-party scripts, long tasks, framework hydration) — read our guide INP at 200ms: Why This Core Web Vital Is Killing Your Conversions. And to understand how synthetic video affects overall web performance, our real cost of rich media in 2026 covers the full picture.
Looking for more on modern web architecture? We've also written about how Astro 7's Rust compiler and Vite 8 Rolldown bundler accelerate builds for content-heavy sites, and about WebGPU production benchmarks for browser-based video processing.
Bottom Line
INP on media-heavy sites doesn't respond to the same playbook as text-based sites. Video players, galleries, sliders, and parallax have unique interaction profiles that need specific diagnostic tools. Combining LoAF to find the root cause and scheduler.yield() to break up long tasks brought our INP from 340ms to 98ms on a real production project — without changing frameworks or sacrificing interactivity.
Next time a client says "the site feels slow when I click," you know exactly what to measure, which APIs to use, and how to fix it.
Need a performance audit for your media site? →
Sources
- Google, "Long Animation Frames API" — developer.chrome.com/docs/web-platform/long-animation-frames
- Chrome Developers, "LoAF has shipped" (June 2024) — developer.chrome.com/blog/loaf-has-shipped
- MDN, "Long animation frame timing" — developer.mozilla.org/en-US/docs/Web/API/Performance_API/Long_animation_frame_timing
- Web Perf Clinic, "LoAF API: Fix Slow INP Guide 2026" — webperfclinic.com
- Web Perf Clinic, "scheduler.yield(): Break Up Long Tasks the Right Way" — webperfclinic.com
- Dan Holloran, "scheduler.yield(): The One-Liner That Fixes Your INP" (June 2026) — danholloran.me
- CrUX / HTTP Archive, "Web Almanac 2025 — Performance"
- Mintec production data — Luxury brand portal project (INP 340ms → 98ms), June 2026
Frequently Asked Questions
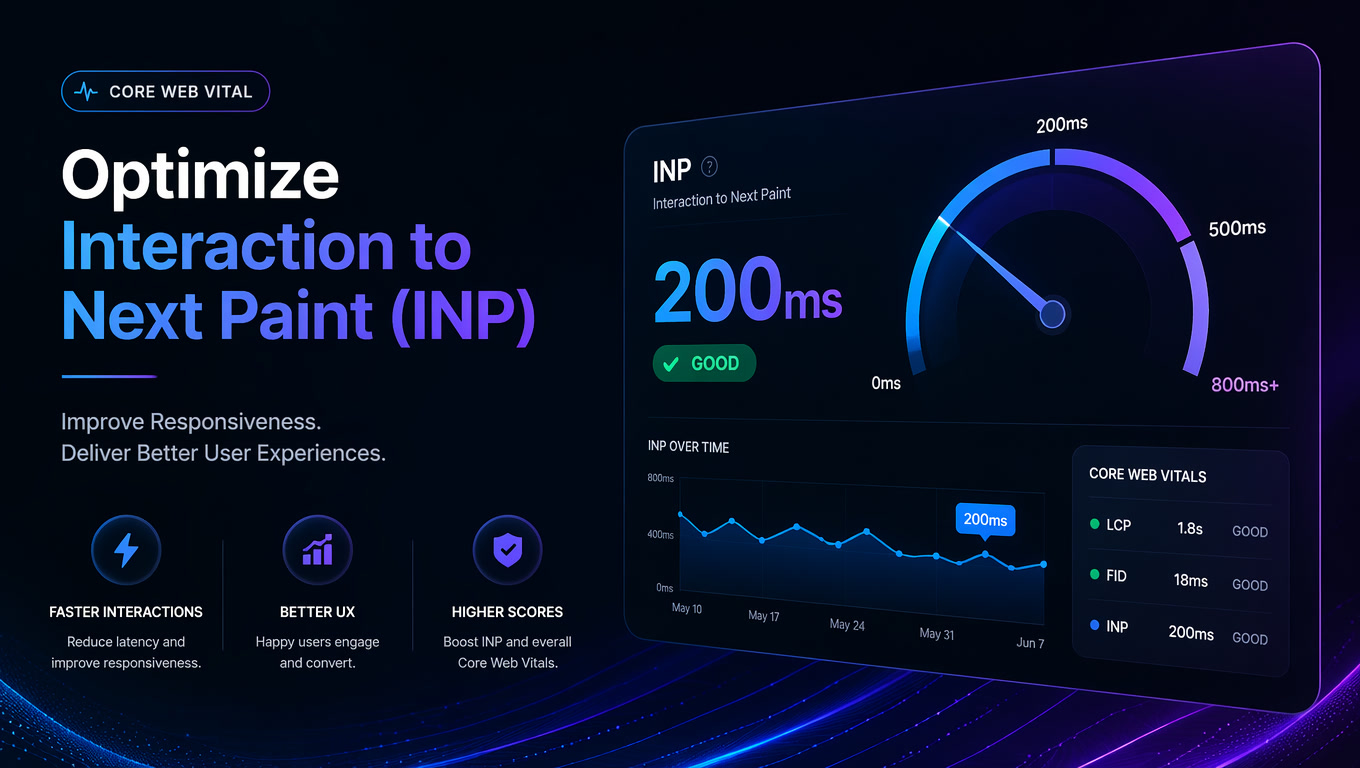
Why do media-heavy sites have worse INP than text-based sites?
Media-heavy sites load video players, image galleries, sliders, and parallax libraries that each add expensive scripts, event handlers, and rendering work to the main thread. These components process heavy work exactly when the user is interacting — clicking a gallery arrow, swiping a slider, or scrolling through a portfolio. The Long Animation Frames API reveals precisely which scripts are responsible.
How does the Long Animation Frames (LoAF) API help diagnose INP?
LoAF captures every animation frame that exceeds 50ms and attributes it to specific scripts — inline or third-party — with their duration, blocking time, and source URL. This allows developers to identify the root cause of INP without guessing or relying on Lighthouse estimates. It works in production with real user data.
What makes scheduler.yield() better than setTimeout for breaking up long tasks?
scheduler.yield() respects the browser's priority system and resumes the task as soon as possible without the 4ms clamped delay imposed by setTimeout(0). This means shorter interruption gaps, better INP scores, and more predictable behavior across different devices and network conditions.