
Google now measures SPA route changes — why your Core Web Vitals can improve without shipping a single line of code
On October 13, 2026 CrUX published experimental LCP, INP and CLS variants that count single-page-app soft navigations, and Cloudflare split INP into three sub-parts in its RUM the same day. CrUX release notes move the global pass rate from 55.9% to 59.5% with nobody touching their site: here are the numbers, who actually changes, and the reading framework we use at Mintec.
On October 13, 2026, Chrome published experimental LCP, INP and CLS variants in CrUX that count soft navigations — the in-app view changes an SPA makes without reloading — and Cloudflare shipped the same day the breakdown of LCP and INP into sub-parts in its Real User Monitoring. The visible effect: the share of origins passing all three Core Web Vitals rises from 55.9% to 59.5% without anyone having changed their site, and for origins with more than 75% soft traffic, "Good" LCP on Android jumps from 26% to 87%. Our read, after going through the web.dev announcement and the CrUX release notes: your score just got kinder, not faster, and anyone treating that delta as a real improvement will skip the diagnosis exactly when it just got cheaper.
What shipped the same day — and why they matter together
These are not two performance stories. They are two sides of the same coin: one changes what the field measures, the other changes how deep you can look when the number moves.
| Release | Date | What changes | Who notices first |
|---|---|---|---|
| CrUX with soft navigations (web.dev) | Oct 13, 2026 | Experimental LCP, INP and CLS variants blending hard and soft navigations, available in BigQuery, the CrUX API and the History API starting with the October release | Any SPA with meaningful internal traffic: its destination URLs start reporting their own metrics instead of inheriting the landing page's |
| LCP and INP sub-parts in RUM (Cloudflare) | Oct 13, 2026 | Dashboard and GraphQL API split INP into inpInputDelay, inpProcessingDuration and inpPresentationDelay, and split connection time into TCP and TLS | Anyone already measuring INP who could not tell which of the three phases was killing them |
The Soft Navigations web platform API has existed in the browser since Chrome 151 (July 2026) — we covered it then, together with interaction-contentful-paint, in Interaction Contentful Paint: finally measuring what happens inside a SPA. What is new is not the API: it is that Google's field data starts counting those navigations. And that does change how a dashboard gets read.
The October release numbers
The September dataset notes — published October 13 across 18,376,044 origins — are the part that hurts in a meeting:
| Metric | Without soft navigations | With soft navigations | Delta |
|---|---|---|---|
| Good LCP | 68.3% | 72.1% | +3.8 pp |
| Good CLS | 81.7% | 85.1% | +3.4 pp |
| Good INP | 85.4% | 87.4% | +2.0 pp |
| All three (overall pass) | 55.9% | 59.5% | +3.6 pp |
Two reads we take from this:
1. INP improves because the rule changed, not the performance. Previously an entire SPA session was summarized by the worst interaction across the session; now each eligible soft navigation is scored per view. In practice that roughly doubles Android INP pass rates for sites that navigate mostly client-side — but SPAs still lag multi-page sites on INP, so the real work on heavy JavaScript during view changes does not disappear.
2. LCP surges because the second visit is cheap. For origins with 75–100% soft traffic, "Good" LCP on Android moves from 26% to 87%: follow-up views reuse code and assets the initial load already paid for. It is a more representative measurement of what the user feels — and at the same time a reminder that your first load is still the face of the site.
Who sees changes, in one table:
| Site profile | What you will see | Action |
|---|---|---|
| Multi-page / SSG (our Astro case) | Nothing: ~70% of CrUX origins have under 5% soft traffic | None. The field was already measuring you |
| SPA with 5–50% soft traffic | Small moves, in one direction | Compare against your own history, not last month: the baseline changed definition |
| SPA over 50% soft traffic (7–11% of origins) | Large jumps, all upward | Capture your experimental baseline now and re-read it in May 2027 |
The same day, Cloudflare sharpened the scalpel
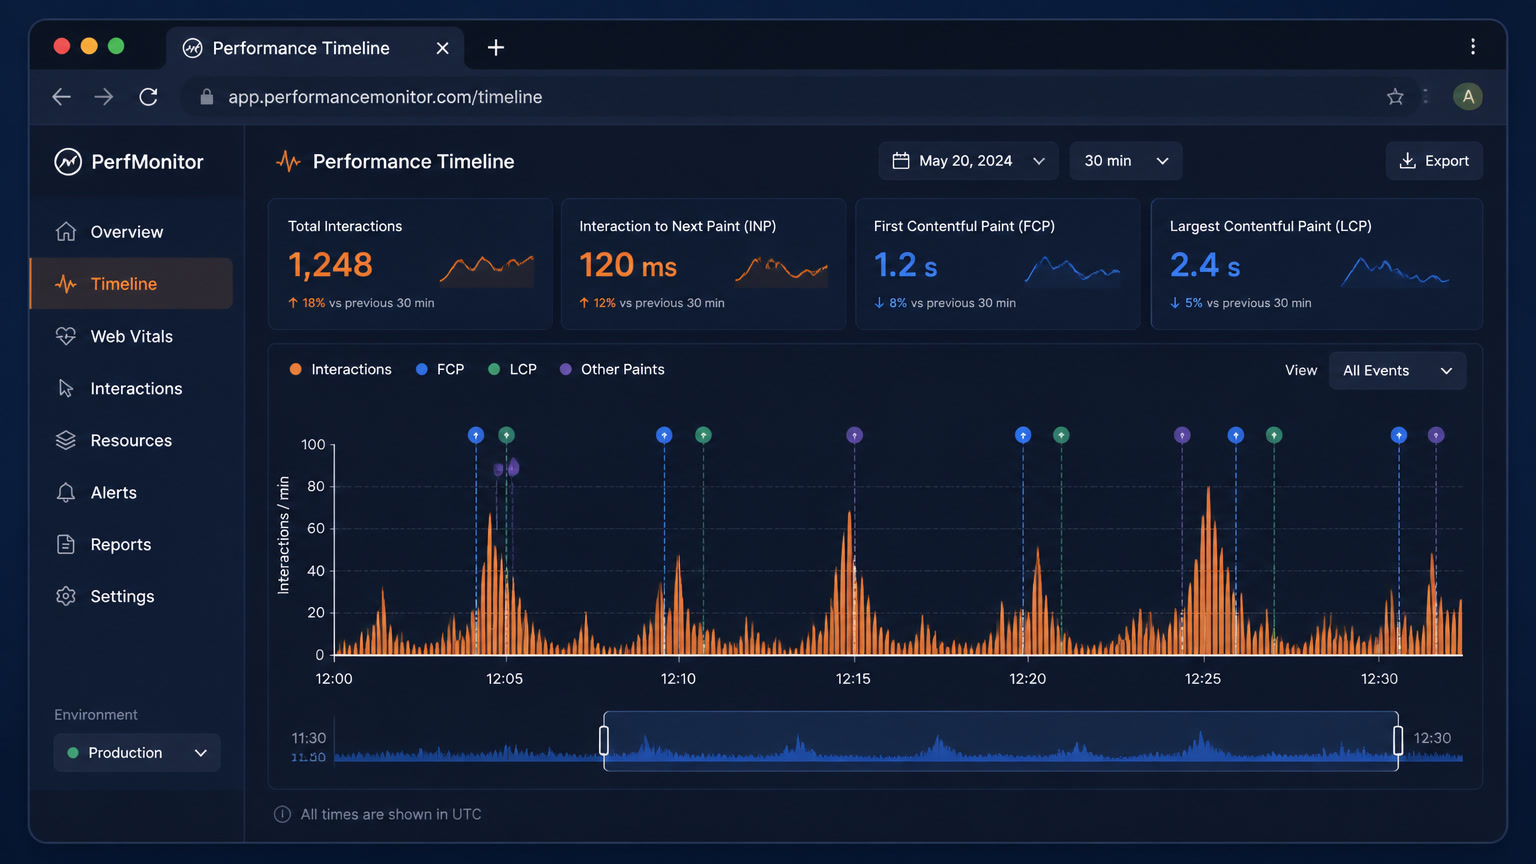
While Google clarified which number you will see, Cloudflare detailed where to look when that number is bad: its RUM now breaks INP into its three phases and LCP into sub-parts, in the dashboard and queryable over GraphQL. It is the same breakdown the BEACON tables we already analyzed in Cloudflare's BEACON dataset brought — only now it is on your own dashboard, with your own users.
The triage framework we apply when a client shows up with red INP:
| INP phase | Field in CrUX/RUM | Typical cause | First move |
|---|---|---|---|
| Input delay | inpInputDelay | A script unrelated to the interaction — tag manager, chat, A/B testing — running long tasks before your handler gets the event | Long-task cutting and scheduler.yield(); third-party audit |
| Processing | inpProcessingDuration | Your handler does all the work before paint: synchronous filtering, analytics on click, broad re-renders | Split the work, defer what is non-critical, memoize the tree that redraws |
| Presentation | inpPresentationDelay | The browser is slow to paint the next frame: huge DOM, layout reads in a loop, expensive shadows and styles | Shrink the live DOM, kill layout-thrashing reads, content-visibility |
The rule we follow: the dominant phase decides who owns the fix. High inpProcessingDuration is your code; high inpInputDelay is almost always third-party; high inpPresentationDelay is architecture. Blending the three into one number — which aggregated INP did — is why so many teams optimize in the wrong direction.
How we read it at Mintec
Our site runs on Astro, multi-page with near-zero JavaScript: the experimental fields will return effectively what the stable ones do, and we will confirm that before spending a single hour on it. The site where the conversation actually changes is a client-side Next.js SPA, and there the protocol we follow is:
- The stable metric stays the source of truth. Google says it explicitly: stable scores do not change while the variant is evaluated. We do not touch goals, contracts or acceptance thresholds over an experimental number.
- Capture the baseline now. The
experimental_*_with_softnavsfields are in BigQuery, the CrUX API and the History API as of the October release; FCP and navigation types arrive in November. Saving October–November costs one query and saves us the mirage of comparing against a definition that will no longer exist. - Diagnose with sub-parts, not the global number. An aggregate INP pass rate up 2.3 pp does not tell you whether your site is one of the improvers or one of the unchanged. Cloudflare's three phases (and the route-level entries we covered in August) do.
- Keep the May 2027 date in the calendar. That is when Search Console switches to the new data. Teams that learned their soft-navigation profile now are not surprised then; the rest will read a "drop" or a "gain" that is only a change of instrument.
The opinion, no hedging
This announcement is a polite trap. A site that goes from 55.9% to 59.5% without touching code did not get faster: it got better measured. The expensive mistake is not misreading the number — it is using the measurement improvement as cover to close the performance ticket. If your INP was red on presentation, it stays red in the experimental variant, because the work during view changes is real and the user still feels it.
The position we hold: measurement is getting kinder exactly when diagnosis is getting cheaper, and that combination lasts until May 2027. Take the window — capture the baseline, split the three phases, fix whichever dominates — before Search Console starts reporting under the new rule and everyone discovers at once what their dashboard had been measuring for two years.
If you are deciding architecture and this change reshapes the conversation, go back to Astro vs Next.js in 2026 — real benchmarks: no experimental number erases the difference between shipping multi-page and shipping a client runtime. And if what you need is where to strike first, the sub-part diagnosis in INP at 200ms is still the starting point.
Frequently Asked Questions
What is a soft navigation in Core Web Vitals?
It is a view change inside a single-page application that updates content and the URL with JavaScript without reloading the document. Before October 2026, CrUX only recorded an SPA's initial hard load and grouped every interaction and layout shift of the whole session into that entry URL; now each eligible soft navigation is measured as its own navigation and reported under the destination URL.
Will my site's metrics change?
For most sites, no: around 70% of CrUX origins have less than 5% soft traffic, and only 7-11% exceed 50%. The sites that change are SPAs with heavy internal navigation, and for them metrics improve or stay the same — they never get worse. The stable Core Web Vitals scores remain unchanged while the experimental variant is evaluated.
When will Search Console use soft-navigation metrics?
Google targets graduating the experimental variants out of experiment status in May 2027, at which point Search Console switches to the new data. Until then, Search Console keeps reporting the stable metrics, so the moment to capture your baseline is now, not after the switch.