
Your CTR benchmark predates the SERP you're measured on
Position bands stopped predicting clicks once AI Overviews and stacked features took the top of the page. Four counts to run before the next title rewrite.
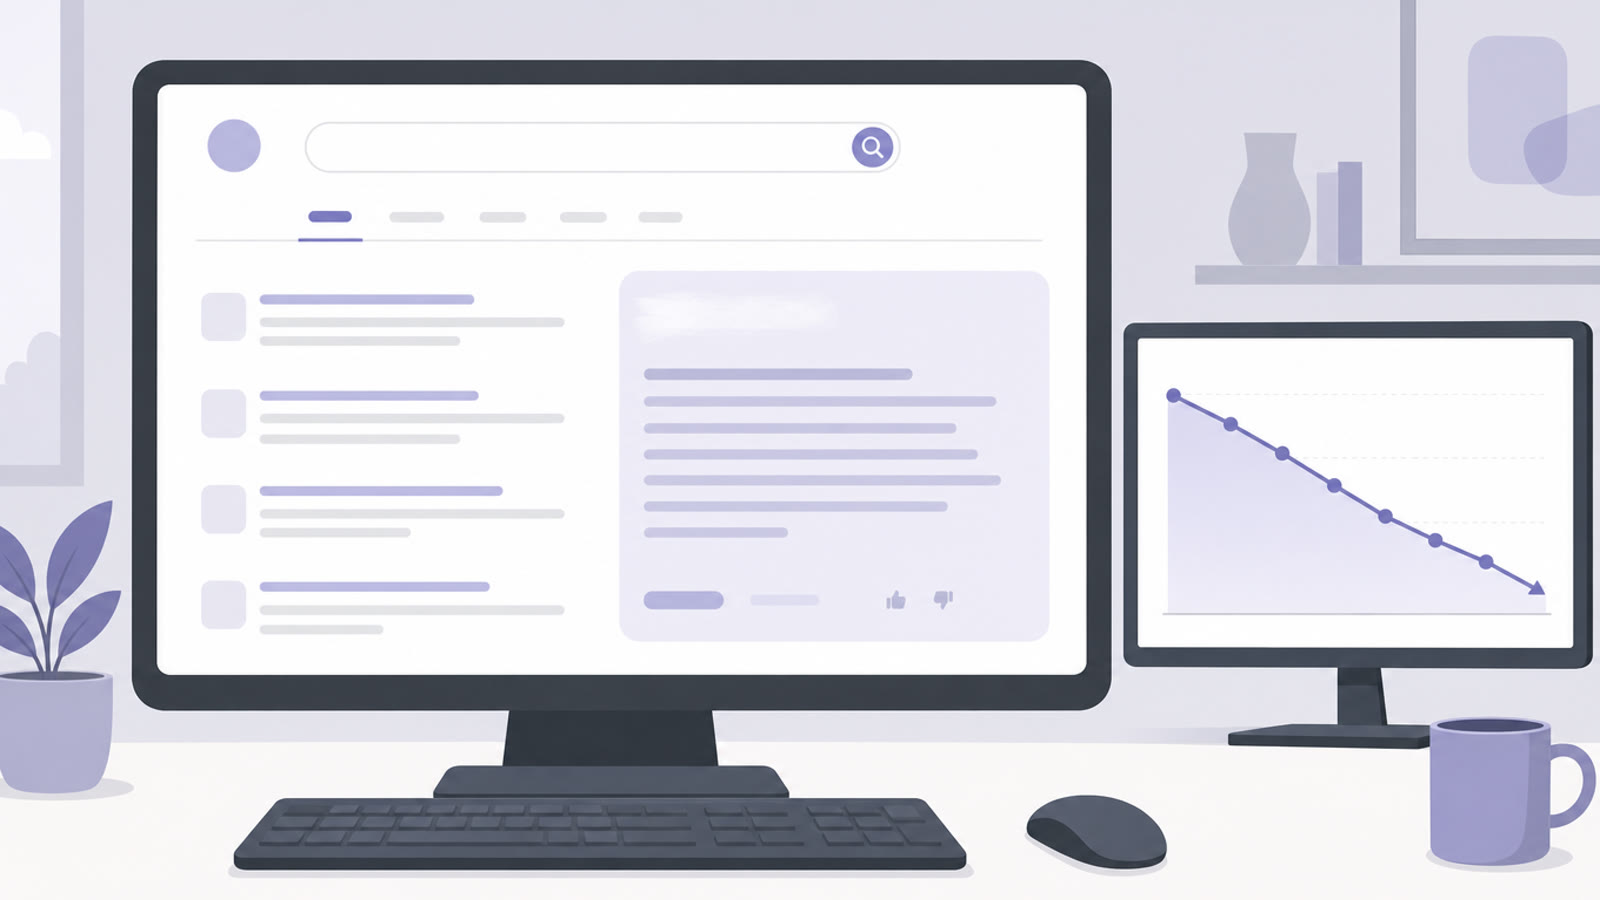
A click-through rate that misses its benchmark is not automatically a copy problem. Most of the time it is a position-and-feature problem wearing a copy problem's clothes, and the fastest way to waste a quarter is to rewrite titles for a page whose SERP stopped paying for titles. Before you touch a tag, pull four counts: the impression trend on the same query set, the position band per query instead of per page, the feature stack sitting above your result, and how much of the query's need the answer on the page already resolves. If the third or fourth count is the one that fails, no rewrite will move the number.
This is not a theory piece. There is fresh public data on the curve you are probably comparing yourself to, and it says the curve moved.
The benchmark everyone quotes was measured on a different page
Advanced Web Ranking's July 2026 Google US desktop snapshot puts the average position-one organic result at 20.02% CTR — and at 9.69% on SERPs where an AI Overview appears. That is a 52% cut at the top. It gets worse as you go down: the same study measures a 64% relative loss at position two and 56% at position three. An AI Overview showed up on 43% of the sampled desktop SERPs.
Three more numbers from that dataset matter more than the headline:
- Positions one through three collect roughly 92% of all clicks that reach the top ten results. Positions four through ten split the remaining 8%.
- From position six onward, CTR converges below 1% on both kinds of SERP — with and without an AI Overview.
Read those two together and a lot of "underperforming" pages stop looking broken. A page at position seven with a 0.4% CTR is not underperforming. It is at position seven, where the ceiling on both SERP types is already under 1%. You cannot rewrite your way from there. You have to move, consolidate, or accept it.
Feature stacking finishes the job. In the same study, an AI Overview alone cost the first result about 36% of its clicks; an AI Overview combined with a local pack, product grids, People Also Ask and a video row took the loss up to 99%. Intent decides how much you feel: navigational queries lose the most at position one, around 30 percentage points, while transactional queries barely move.
Pew Research Center approached the same behavior from the other side, tracking the browsing of 900 US adults in March 2025. Users who encountered an AI summary clicked a traditional result in 8% of visits; without a summary, 15%. A click on a link inside the summary happened in 1% of visits. And 26% of visits to a page with a summary ended the browsing session there, against 16% without one.
Google has publicly disputed the methodology behind that kind of panel study, and the objection has some force: panel data infers intent it cannot observe. But notice what the disagreement is about. Pew measures behavior across a panel; Advanced Web Ranking measures the CTR of results that were shown. Different denominators, same direction. Neither is your benchmark, because both are averages over query sets that are not yours — which is why the diagnosis has to happen per query.
Count 1 — Impressions on the same query set, not total impressions
A page's impression count is also a query-breadth meter. When Google starts matching a page to adjacent queries it did not use to win, impressions climb and CTR falls without anything changing on the query you care about. The report looks like a CTR collapse. It is a dilution event.
So pull the query rows for two comparable windows and keep only the queries that existed in both. Compare clicks on that fixed set. If the old rows held, the page did not change — Google changed who it shows the page to. If the old rows lost clicks while the new rows added impressions, you have a genuine query-fit problem, which is a different repair.
Count 2 — Position band per query, not average position per page
Page-level average position hides bimodality. A page averaging 5.4 might be 2.1 on the one commercial query that pays the bills and 40 on the twenty informational queries supplying most of the impressions. Improving that average is not the same as improving the clicks.
Sort the query rows by impressions and read the position column per row. The question is never "where does the page rank." It is "where does it rank on the queries that can still produce a click." Given the AWR curve, that window is narrow: top three for volume, top five for anything meaningful, and effectively closed from six down.
Count 3 — The feature stack above the result
This is the count almost nobody keeps, and it now decides more clicks than the title does. For each of your top queries by impressions, record what sat above you: AI Overview, local pack, shopping grid, video row, People Also Ask, top stories, ads.
Two pages can share a position and a title pattern and still produce 4% and 0.3%, because one is competing with a single feature and the other is competing with four. Until that column exists in your reporting, every CTR conversation is an argument about a number with no context.
You do not need a platform for this. Twenty queries, once a week, one column in a sheet. The value is not precision; it is that you stop treating a stacked SERP and an open one as the same problem.
Count 4 — Residual need: what is left to do after the answer
This is the count that decides whether a click is even available, and it is editorial rather than technical.
After reading the answer in the SERP, what does the searcher still have to do? If the answer fully resolves the query — a date, a price, a definition, a yes or no, a phone number — the click is a bonus and no title will manufacture it. If the searcher still needs a decision (which of these for my case), a number computed from their inputs, a file they can hand to someone else, or a sequence they have to follow, the click survives even a fully stacked page.
Pew's 1% is the extreme case: summaries citing three or more sources, a median length of 67 words, and almost nobody clicking through from the summary itself. An answer engine is very good at closing a question that has one answer. It is much worse at closing a question that has a decision inside it. That gap is where organic clicks still live, and it is a content design problem, not a metadata problem.
The four counts become one decision
| What the counts show | Actual cause | What to do | What not to do |
|---|---|---|---|
| Impressions up, clicks flat, old queries stable, feature stack heavy | Demand-side absorption | Add what the answer cannot supply: a decision table, a calculator, per-case numbers, a template | Rewrite the title |
| Impressions stable, position six or worse, low CTR, any stack | Out of the click window | Consolidate overlapping URLs, earn links to the one page that should rank, or accept the ceiling | Commission a sitewide snippet sweep |
| Position two to five, CTR far under the band, light stack | Genuine snippet mismatch | Now rewrite title and description, and test one variable at a time | Rewrite forty pages at once |
| Position stable, branded queries convert, non-branded dead | Query fit | Rewrite the page to the query it is actually being shown for, or split it | Blame the meta description |
| Position collapsed this month | Not a CTR problem | Diagnose the ranking loss first | Anything else |
The rule underneath the table: a rewrite only changes the promise. If the supply of clicks is capped by position or by the SERP, a better promise has nowhere to land.
Why the rewrite looks like it worked anyway
CTR is a ratio, and ratios flatter interventions. If impressions rise 30% because the query mix widened, CTR falls even with the same click count — and if you shipped a rewrite in the same fortnight, the rewrite gets the credit or the blame for arithmetic.
Timing does the rest. Google's November 2026 core update is still settling, and the generative AI reporting gap earlier in the month already makes clean before-and-after comparisons hard — the ordering of those two events decides what your chart even means. A snippet change shipped inside a core update window is not a test, it is a coincidence with a changelog.
There is a quieter reason the sweep keeps coming back: a title rewrite is a one-line diff you can point at in a report. "This page sits at position seven behind four SERP features, and the query has no residual need" is not a diff. That asymmetry, not evidence, keeps the sweep alive.
Google did add measurement capability this week: the Search Analytics API now returns branded-query classification, web multimodal rows, and multi-country or multi-device filters in one request. Useful, and still slicing the same two numbers. More dimensions do not tell you what was above your result.
What to measure instead
- Query-level cohort CTR. The same query rows, both windows, nothing added. This is the only CTR comparison that isolates your page from Google's matching. We covered the mechanics in what to measure when AI Overviews lose their label.
- Outbound click-through on the pages you are arguing about. Sessions and engagement tell you whether the arrivals were worth having.
- Citation share on answer-shaped queries, because there the fight is for the source row rather than the click. The click distribution inside a citation block is covered in how citation order splits AI Overview clicks.
- Nothing about conversions unless the page actually records an outcome. With no key event on the template, a conversion claim is a guess with a decimal point.
In client work, the pages that recovered a click path were rarely the ones with the sharpest titles. They were the ones that answered the second question — the one the summary left open — on the same page the searcher already trusted. That is a slower fix and a more durable one.
If you want a second read on which of your pages are absorbed by the SERP and which are genuinely mismatched, that diagnosis is where our SEO and GEO work starts. Bring your query export; the four counts take about an hour.
Frequently Asked Questions
My rankings are stable but CTR dropped. Did an AI Overview do it?
Not necessarily, and you can't tell from the page-level report. Page CTR moves for three reasons that look identical: the query mix widened, the position band changed under a stable average, or the SERP above your result gained features. Pull the query rows, keep only the queries that existed in both windows, and compare those. If the old rows held their clicks, the page did not change — the set of queries Google matched it to did.
Is rewriting the title tag still worth doing?
Yes, but only in one of the four diagnostic cases: your position is inside the band where clicks are still available, the SERP above you is not stacked, and the description fails to state what the page delivers. Outside that case a rewrite is a placebo, because it changes the promise without changing either the supply of clicks or the reason the searcher did not need one.
How do I know whether an AI Overview appeared on my queries?
Search Console gives you impressions, clicks, position and CTR per query. It does not hand you the rest of the page as a per-query column, so you have to sample it: take your top queries by impressions once a week, record whether an AI Overview, local pack, shopping grid, video row or People Also Ask block was present, and keep that as a column next to the numbers. A spreadsheet is enough. The point is to stop guessing which SERP you are competing on.