
Measure What Matters: The Ultimate AI Chatbot Quality Scorecard
A 5-dimension scorecard to evaluate your AI chatbot's real quality, with industry benchmarks and data from real implementations across Latin America.
A chatbot can show 80% deflection rate and still deliver terrible service. Deflection rate measures how many conversations DIDN'T escalate — not how many were actually resolved well. At Mintec, we've audited dozens of production chatbots for clients across Mexico, Colombia, and Peru, and we see the same pattern every time: teams measure the wrong metrics, make decisions based on misleading dashboards, and end up with a chatbot that looks great in reports but leaves users frustrated.
The industry has a measurement problem. According to Digital Applied's 2026 data, the average autonomous resolution rate — conversations the chatbot resolves without human intervention AND with acceptable quality — sits at just 44.8%. Top teams hit 89%, but most are far below. The gap isn't about technology. It's about what they measure and how they act on it.
This article is the scorecard we use at Mintec to evaluate production chatbots. Five dimensions, real benchmarks, built on tools any SMB can afford.
Why Deflection Rate Is Lying to You
Deflection rate — the percentage of conversations the chatbot handles without escalating to a human — is the most common metric and the most dangerous one. Because a chatbot can deflect a conversation toward a wrong answer. The user walks away without a solution, doesn't escalate because they can't find the button, and the conversation gets logged as "resolved."
During an audit for a dental clinic in Mexico City, the dashboard showed 73% deflection. When we reviewed the actual conversations, 40% of those "resolved" interactions ended with the user either asking the same question differently or giving up entirely. The real resolution rate — conversations where the user actually got what they needed — was barely 38%.
Deflection rate is useful as a volume metric. But as a quality indicator, it's worse than useless: it's misleading.
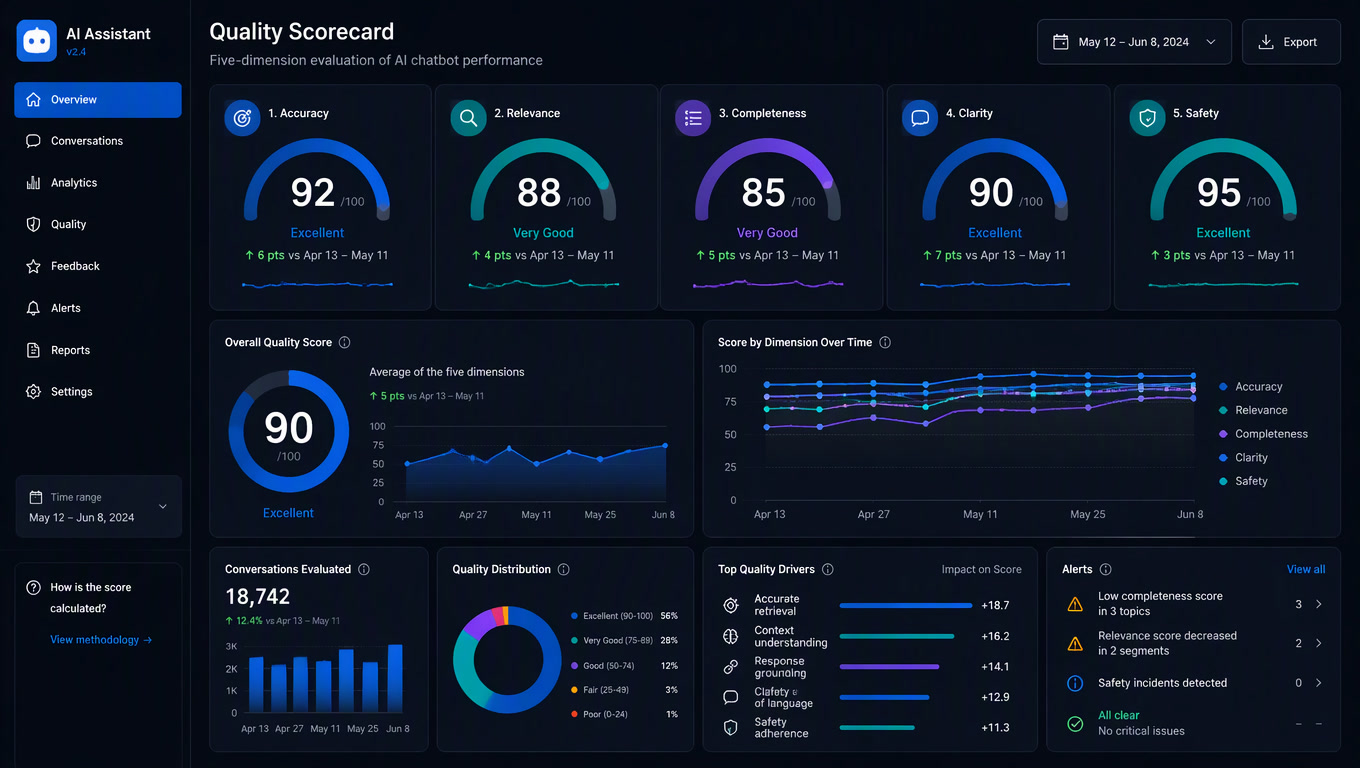
The 5-Dimension Quality Scorecard
We developed this framework after evaluating chatbots across a dozen implementations. Each dimension has a weight, a benchmark, and a concrete action when it's out of range.
D1: Autonomous Resolution Quality (Weight: 35%)
This is NOT deflection rate. This measures: of the conversations the chatbot handled alone, how many actually gave the user what they needed?
| Level | Range | Signal |
|---|---|---|
| Elite | > 80% | Bot resolves consistently. Monthly KB review sufficient. |
| Good | 55-80% | Working well but leaking. Bi-weekly KB audit. |
| Average | 35-55% | Matches industry benchmark (44.8%). Need failure pattern analysis. |
| Critical | < 35% | Bot is creating more frustration than value. Immediate intervention needed. |
Benchmarks: Industry average 44.8% (Digital Applied/Lorikeet CX 2026). Top teams with well-scoped scope: 89%. Bots trained on up-to-date knowledge bases: 50-70% (Oscar Chat).
How to measure it: Every conversation needs a confirmation signal — a "did this solve your issue?" prompt at the end, or post-interaction classification. Without that signal, any resolution rate is an estimate.
D2: Escalation Efficiency (Weight: 20%)
When the chatbot can't resolve, how well does it pass context to a human? This is the most ignored dimension and the one with the biggest impact on user experience.
| Indicator | Good | Fair | Poor |
|---|---|---|---|
| Context preserved | 100% of relevant data passes to agent | Summary passes but key data missing | User has to repeat everything |
| Post-escalation response time | < 2 min | 2-5 min | > 5 min |
| Re-escalation rate | < 5% | 5-15% | > 15% |
Real data: In an insurance client implementation in Bogotá, 30% of escalations failed because the chatbot passed a generic summary without specific claim details. The human agent spent 3-4 minutes asking for information the user had already provided. We fixed the handoff by extracting key fields with n8n before escalating.
Direct retention impact: According to Gainsight and Totango data, poor escalation experiences are responsible for 23% of service cancellations linked to onboarding or support. A badly designed handoff nullifies your chatbot investment.
D3: User Satisfaction (Weight: 25%)
Post-interaction CSAT is the only metric that measures what actually matters: was the user happy?
Benchmark: The 2026 average CSAT across customer service is 76.7 (ACSI), with leadership at 80-83 (SpaceForms). For chatbots specifically, the average is 70-78 when well-implemented, and below 65 when they're not.
| Score | Interpretation |
|---|---|
| > 85 | Excellent. Bot exceeds expectations. |
| 75-85 | Good. Within industry range. |
| 65-74 | Fair. Quality issues affecting experience. |
| < 65 | Critical. Bot is damaging customer relationships. |
Common trap: CSAT surveys reach only 5-15% of users. A small sample with extreme bias (very happy and very frustrated users respond more) can distort results. Complement with sentiment analysis on actual conversations.
D4: Cost per Conversation (Weight: 10%)
Unit cost is the metric that justifies (or kills) the chatbot investment.
| Component | AI Chatbot | Human Agent |
|---|---|---|
| Cost per resolution | $0.62 (McKinsey) | $7.40 (McKinsey) |
| Cost per escalation | $0.62 + $7.40 | — |
| Monthly maintenance | $200-500 + 20-30% of build/year (KUMO) | $1,500-2,500/mo per agent |
The trap: Cost per conversation looks great when you only count resolved conversations. When you include escalations and maintenance, the real number is 30-50% higher than what your dashboard shows.
If your chatbot has a 44.8% resolution rate (industry average), 55.2% of conversations it starts end up escalating to a human. In that scenario, the chatbot isn't reducing costs as much as it seems. The equation flips when you cross 65% resolution.
How to calculate it right:
Real Cost = (Total Volume × %Resolved × $0.62) + (Total Volume × %Escalated × $7.40) + Maintenance Cost
D5: Continuous Improvement Velocity (Weight: 10%)
The most predictive dimension: how fast do you detect failures, diagnose them, and fix them?
| Velocity | Cycle | Team Profile |
|---|---|---|
| Reactive (> 2 weeks) | Detect failures through user complaints | No chatbot ownership |
| Scheduled (weekly) | Weekly failed conversation review | Part-time chatbot owner |
| Continuous (daily) | Auto alerts + daily review | Chatbot owner + monitoring tools |
| Autonomous (real-time) | Self-correcting with feedback loops | Mature stack with n8n + AI |
Key data point: According to SmartDev, model drift — gradual accuracy degradation — starts showing between weeks 4 and 6 after the last training cycle. If your improvement cycle is monthly, you're running a chatbot that's been getting worse for two weeks before you notice.
In practice, we run a 4-week cycle that starts with KB audit and ends with prompt adjustments:
| Week | Activity | Owner |
|---|---|---|
| 1 | Audit knowledge base: add new questions, remove stale ones | Chatbot owner |
| 2 | Review failed conversations: identify patterns | Chatbot owner |
| 3 | Adjust prompts based on detected patterns | Technical support |
| 4 | Review global metrics, plan next cycle | Owner + technical |
How to Implement the Scorecard Without Expensive Software
You don't need an enterprise platform to run this scorecard. A modular stack gets it running in a week:
- n8n self-hosted ($6-20/mo) for metric collection orchestration
- Clientify ($0-99/mo) as CRM for CSAT tracking and follow-up
- Google Sheets + Looker Studio (free) for the weekly dashboard
- OpenAI API ($20-50/mo) for conversation sentiment analysis
Total monitoring stack cost: $26-169/mo.
The #1 Mistake: Measuring Without Acting
The scorecard only works if every metric has a "so what." If autonomous resolution quality drops below 45% for two consecutive weeks, the action is clear: audit the knowledge base. If CSAT drops below 70, review tone and prompts. If cost per conversation rises, check the escalation rate.
We've seen teams install beautiful dashboards with 20 charts and then change nothing for months. The scorecard isn't a report. It's a decision system.
If you built your chatbot following our training and continuous improvement framework, this scorecard is the next step — it tells you if your training is actually working. If you're still deciding whether a chatbot makes sense for your business, the cost framework has the numbers. And if you suspect the problem isn't your chatbot but your operational processes, start with the operational diagnostic.
The quality of an AI chatbot isn't measured on your vendor's dashboard. It's measured in the conversations users have with it, the escalations that shouldn't happen, and how fast you fix what's broken. That's what this scorecard gives you. Everything else is just pretty charts.
Frequently Asked Questions
What metrics should I use to evaluate my AI chatbot's quality?
The 5 key dimensions are: autonomous resolution quality (not just rate), escalation efficiency, user satisfaction (post-interaction CSAT), cost per conversation (including maintenance and model drift), and continuous improvement velocity. Measuring only deflection rate creates a false sense of success.
What is the industry average autonomous resolution rate?
According to Digital Applied and Lorikeet CX 2026 data, the industry average is 44.8%. Top-performing teams with well-defined scope reach 89%. A good target range is 50-70% for AI chatbots trained on up-to-date knowledge bases.
How often should I review my chatbot metrics?
Operational metrics (cost per conversation, resolution rate) should be reviewed weekly. CSAT surveys and improvement velocity are monthly reviews. The full scorecard should be evaluated quarterly. Two consecutive weeks of declining resolution signals a stale knowledge base.