
Automating Client Reporting: From 8 Hours of Manual Work to 20 Minutes with AI
An agency managing 30 clients spends 90 hours per month copying numbers from GA4, Ads, and Meta into spreadsheets. We show the complete stack — n8n, Claude, and branded templates — that reduced that to 5 hours of review, with real implementation data.
Automating Client Reporting: From 8 Hours of Manual Work to 20 Minutes with AI
If your agency manages 20 or more clients, your team probably spends 5-10 hours per week compiling performance reports. Pulling metrics from GA4, pasting them into a spreadsheet, adding Google Ads data, including Meta numbers, writing a summary, and emailing it. Repeat for every client. Every week.
We've seen agencies where the account manager dedicates entire Mondays to this. Not strategy. Not retention calls. Not optimization. Copying and pasting numbers. And the worst part: 41% of those reports arrive late, because someone got sick, had an emergency, or simply forgot.
This is what we changed for clients at Mintec, and what the data shows after 90 days of implementation.
The real problem: it's not the time, it's what you lose
Most agencies calculate the cost of reporting in hours: "My AM spends 3 hours per client, I have 30 clients, that's 90 hours per month." That's correct but incomplete.
The real cost includes:
- Lost opportunity: those 90 hours are retention calls that didn't happen, optimizations that weren't executed, upsells that went undetected
- Copy-paste errors: a wrong number in a client's ROAS can drive an incorrect budget decision
- Format inconsistency: every AM reports differently. One client gets a polished PDF; another gets an email with pasted tables
- Cumulative delays: when the report arrives Tuesday instead of Monday, the client loses confidence that you're on top of their account
According to industry data (Endigita, 2026), agencies managing 20+ accounts report a 40-60% reduction in administrative overhead after automating reporting. But the metric that mattered most to us was different: client retention rose 11 percentage points in agencies that implemented consistent, on-time reporting.
The 4-layer architecture that works
We're not talking about a Looker Studio dashboard with the client logo swapped in. That's what most agencies already have, and it's why clients feel reports are generic.
Real automated reporting has three functional components working together:
Layer 1 — Data extraction (automation) An n8n or Make workflow that triggers every Monday at 6am. It reads client configuration (which channels to report, which KPIs to include, who to send to) from Airtable or Google Sheets. In parallel, it pulls data from GA4, Search Console, Google Ads, and Meta Ads. Not sequential — parallel. Extraction time per client: 30-45 seconds.
Layer 2 — Anomaly detection (rules) Before the AI writes anything, a deterministic layer calculates WoW (week-over-week) and YoY (year-over-year) deltas. It identifies the 3-5 most significant movements: what went up, what went down, what fell outside the expected range. This is critical — without it, the AI generates generic observations like "traffic remained stable." With it, it generates "organic sessions dropped 18% vs last week, driven by a decline in the 'CRM pricing' keyword that represented 12% of traffic."
Layer 3 — AI narrative (intelligence) Claude or GPT-4o receives the detected deltas + client context (industry, goals, history) and writes the insights section in the agency's voice. Not "CTR improved 12%." But: "Click-through rate climbed to 3.2%, a 0.4 percentage point jump that coincides with the keyword refinement we activated last week. We recommend maintaining direction and testing a variant with more direct copy on search ads."
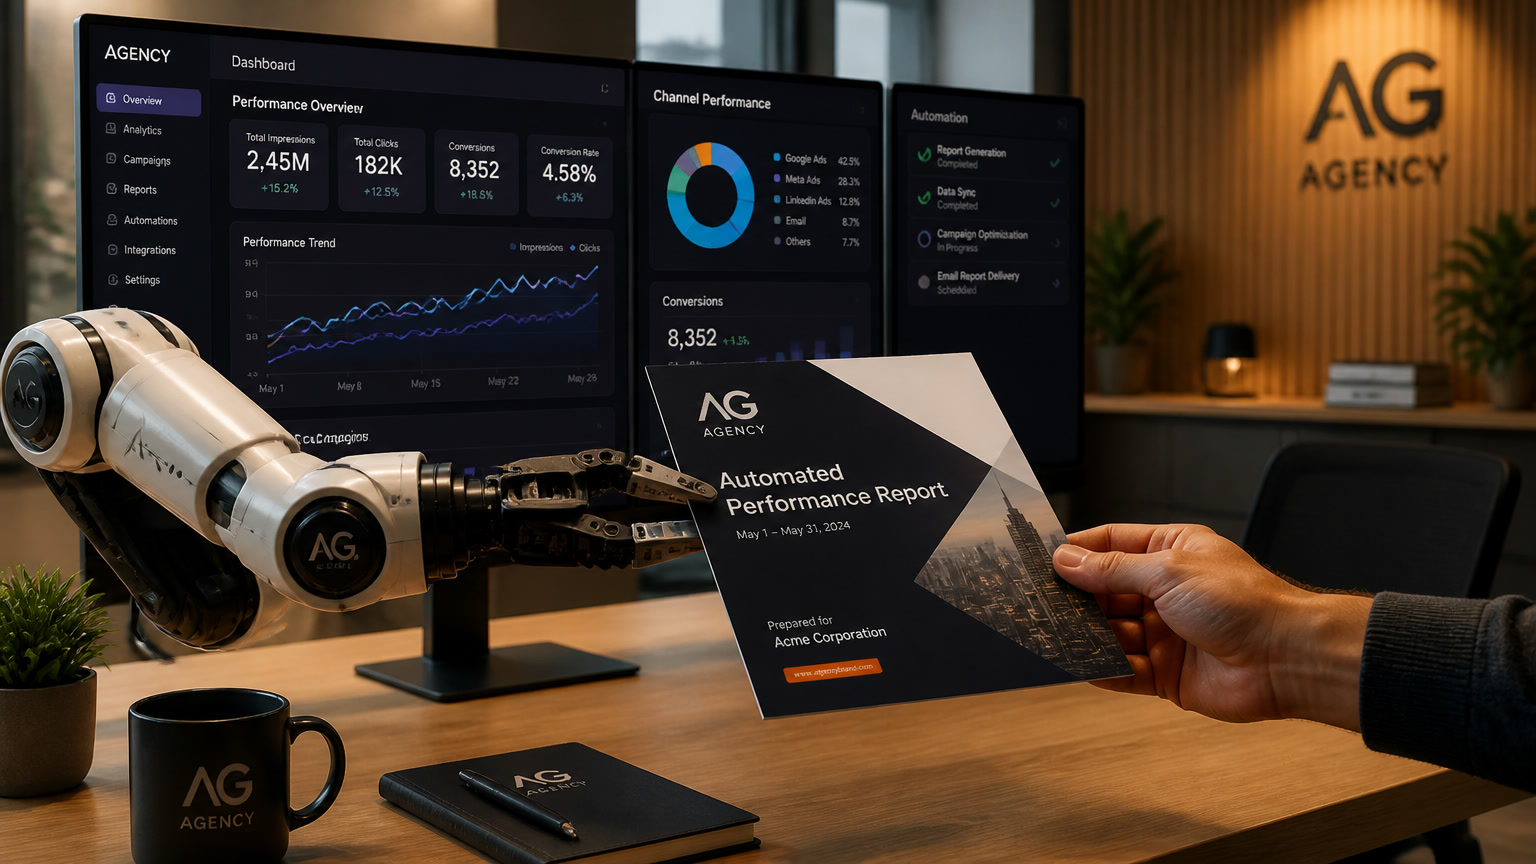
Layer 4 — Branded delivery (distribution) A PDF generated with Puppeteer using the client's HTML template (logo, colors, AM signature). Emailed to the client and posted in the AM's Slack channel for pre-send review. The AM has 15 minutes to adjust something. If no changes, it auto-sends at 9am.
The real numbers: 90 days in
We implemented this architecture for a digital agency with 32 retained clients (4 AMs, 2 senior strategists, mixed SEO and paid retainers averaging $4,200/month). No change in service offering — the lift comes entirely from recovered time and consistent delivery.
Results at 90 days:
- Reporting hours recovered: 29 hours/week (vs ~35 hours/week baseline of manual reporting)
- On-time Monday delivery: 98% (vs 41% baseline)
- Client NPS: +19 points (measured at 90 days)
- 12-month logo retention: +11 percentage points (only visible at the 9-month mark)
- Report email open rate: 71% stable (anything below 50% triggers an automatic alert for the AM to schedule a check-in call)
The internal metric that mattered most: what did AMs do with the 29 recovered hours? More strategy calls. More proactive optimizations between reporting cycles. And the bandwidth to absorb new retainers without hiring.
Comparison: how much it costs vs how much it saves
| Metric | Manual | Automated |
|---|---|---|
| Cost per report (AM time) | $52-78 (3 hrs × $17-26/hr loaded) | $5-8 (10 min review) |
| Monthly cost (30 clients) | $1,560-2,340 | $150-240 + stack $177 |
| Data errors per month | 3-5 (copy-paste) | 0 (direct API) |
| On-time delivery | 41% | 98% |
| Scaling capacity | Linear (more clients = more hours) | Sub-linear (more clients = same infra) |
The complete stack for 30 clients costs approximately $177/month in tools: n8n self-hosted ($48 on VPS), Claude API for insights (~$48/month), Postmark for transactional email ($15), Airtable for client config ($60), and a lightweight server for Puppeteer ($6). That's $177 vs $1,560-2,340 in human time.
The decision framework: build vs buy
There are three paths to automating client reporting. None is universally correct:
Path A — Dashboard without AI (Looker Studio, Databox, Funnel)
- Cost: $0-200/month
- Advantage: fast to set up, data always current
- Limitation: the client sees charts but doesn't understand what they mean. No narrative insights generated. The AM still spends time writing the executive summary.
- For whom: agencies with <10 clients that need to present data visually
Path B — n8n/Make + AI (the one we described)
- Cost: $100-250/month for 30 clients
- Advantage: data + insights + branded delivery in one flow. The AM only reviews, doesn't build.
- Limitation: requires 70-110 hours of initial implementation (or 4 weeks with a technical team)
- For whom: agencies with 15-50 clients that want to reduce operational load without hiring
Path C — Specialized SaaS platform (Whatagraph, AgencyAnalytics, ReportGarden)
- Cost: $300-800/month depending on volume
- Advantage: zero technical setup, visual interface, support included
- Limitation: costs spike with volume, less flexibility for custom logic, vendor lock-in
- For whom: agencies that prioritize simplicity over control and can absorb the cost
Our recommendation for LATAM agencies: Path B. Path C costs are prohibitive for average retainers of $2,000-4,000/month. And Path A doesn't solve the core problem — the insights section remains manual. With self-hosted n8n, cost per report trends toward zero as you scale.
Mistakes we see during implementation
After several implementations, patterns repeat:
Starting with all channels at once. Start with GA4 + one more (Ads or Meta). Add channels after the first flow runs 4 weeks without issues.
Not tuning the AI prompt. The initial prompt always produces generic text. You need 4-6 iterations with real historical data for the AI to learn your agency's voice. Explicitly define: "never use 'robust,' 'holistic,' or 'leverage.' Write like a human strategist, not a dashboard."
Ignoring the anomaly layer. Without it, the AI generates superficial observations. With it, it generates actionable alerts that clients value.
No human review. The AM must review every report before sending, at least for the first 4 weeks. Automation eliminates construction, not supervision.
Forgetting the open-rate metric. If report open rate drops below 50%, something is failing: the content isn't relevant, the format doesn't work, or the timing is off. Monitor this actively.
The next level: proactive reporting
Once weekly reporting works, the leap is moving from "reporting what happened" to "detecting what needs attention."
With the same infrastructure, you can add:
- Real-time anomaly alerts: if a client's CPA spikes on a Tuesday at 3pm, the AM gets a Slack notification before the client asks
- Upsell opportunity detection: when a client approaches their ad plan limit or traffic exceeds their tier threshold, the system proactively suggests an upgrade conversation
- Competitive benchmarking: connect SEMrush or SimilarWeb data to contextualize client performance against their market
This turns reporting from an operational cost into a retention and growth engine. Clients don't pay to see numbers — they pay to understand what to do with them.
At Mintec we automate client reporting for agencies in LATAM and Spain. If your team spends more than 5 hours per week compiling reports, there's a more efficient flow. Let's talk.
Frequently Asked Questions
How much time does automating client reporting save?
An agency with 30 clients saves 40-80 hours per month. Per-report generation drops from 2-3 hours to 5-10 minutes of review. The ROI is measured in recovered hours that the team redirects toward strategy and retention, not copying numbers.
What tools do I need to automate client reporting?
Four layers: an orchestrator (n8n self-hosted or Make), data APIs (GA4, Google Ads, Meta Ads, Search Console), an AI model for narrative generation (Claude or GPT-4o), and a delivery system (email + branded PDF). Total cost: $100-250/month for 30 clients.
Do clients prefer automated or manual reports?
71% of clients open automated weekly reports (vs 41% manual on-time delivery baseline). The key isn't automation itself — it's that reports arrive on time, with actionable insights and consistent formatting. Automation eliminates the delay, not the quality.