
The Most-Clicked Meta Video Ads Generate Fewer Sales — What 88,000 Ads Reveal
An analysis of 88,329 Meta video ads shows categories with the highest CTR deliver the worst return on ad spend. Why optimizing for clicks is costing you money.
Your engagement metrics are lying to you — and here's the evidence
We manage Meta Ads campaigns for clients every day. And one of the most common mistakes we see is optimizing for CTR and hook rate as if they were synonyms for sales. They're not. And now there's hard data to prove it.
An analysis by Billo — a UGC content marketplace — examined 88,329 sales-focused Meta video ads that ran between January and June 2026. The dataset covers $122 million in ad spend and $212 million in purchase value. This isn't a survey. It isn't an opinion piece. It's real data from real campaigns.
The findings are uncomfortable for anyone measuring their campaigns by the wrong metric.
The finding that changes the conversation
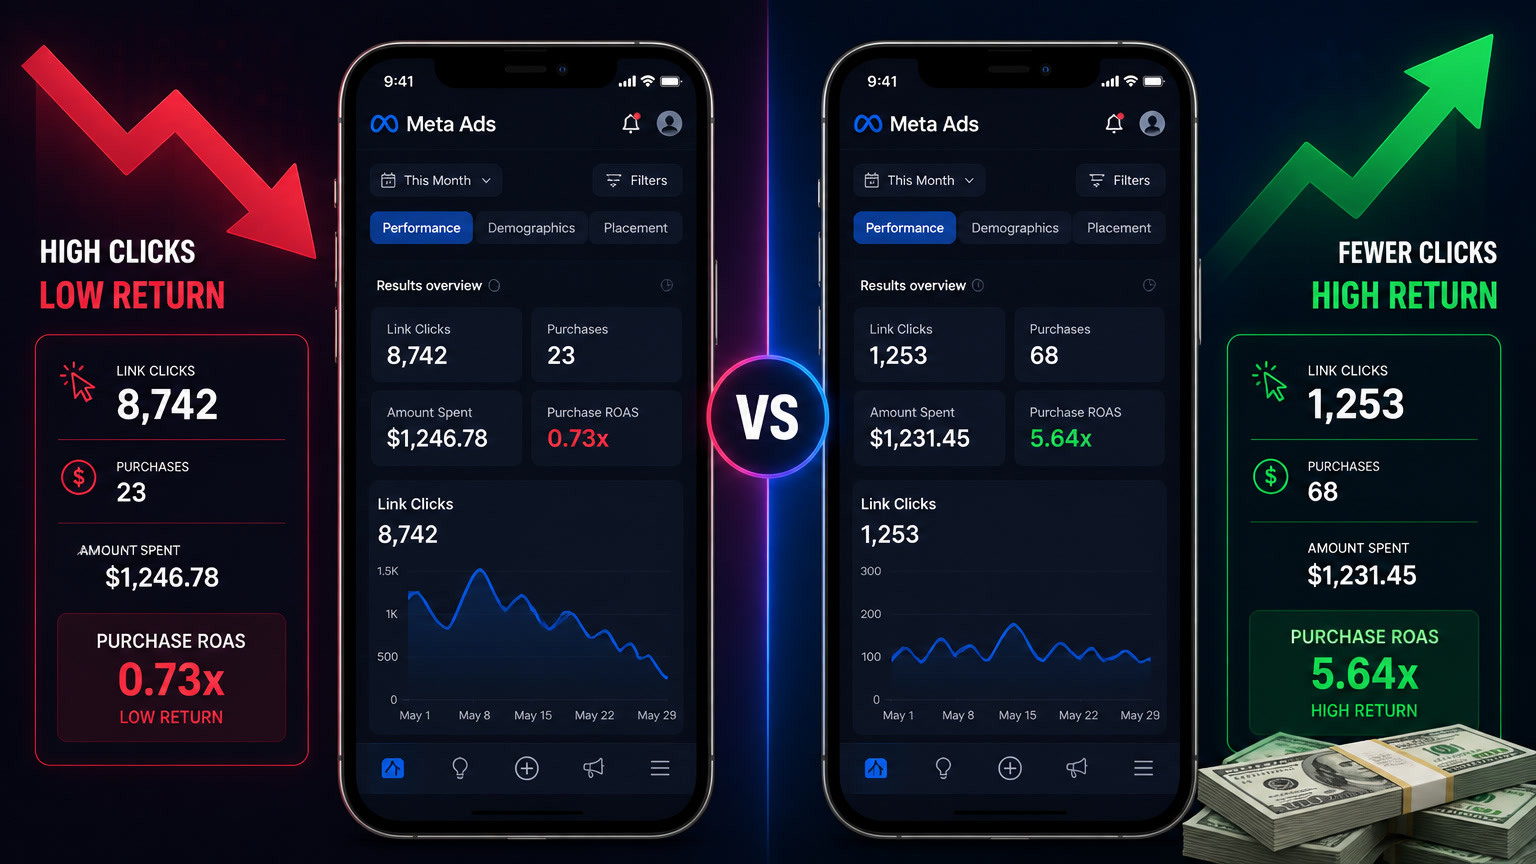
The category with the highest CTR was Health & Beauty: 2.36%. Its ROAS: 1.82. The category with the lowest CTR was Baby & Toddler: 1.37%. Its ROAS: 4.99.
Do the math. The category that attracts the most clicks produces an ad return 63% lower than the category that attracts the fewest clicks.
What's happening here? What we always suspected but didn't have data to assert with confidence: the hooks that capture the most attention don't necessarily attract the people who are going to buy. An ad that appeals to everyone pulls in a lot of people who were never going to purchase. A narrower ad might get fewer views, but it reaches people who actually want the product.
The critical distinction: engagement vs. intent
When you optimize for CTR, you're telling Meta: "find me people who click." And Meta obeys. It brings you clickers. But clicking an ad and pulling out a credit card are two completely different behaviors.
In our experience managing Meta accounts, we see this pattern constantly:
- Sensationalist hooks ("You won't believe what this product does!") generate high CTR but low ROAS. They attract the curious.
- Specific hooks ("This moisturizer has 4 ingredients your dermatologist should recommend") generate moderate CTR but high ROAS. They attract buyers.
- Educational content that shows the product in real context generates the lowest clicks of all — but the people who arrive are already ready to buy.
The confusion arises because CTR and hook rate are immediate feedback metrics. You can see them in hours. ROAS takes days. It's tempting to optimize for what you can see quickly, but it's a trap.
What the data shows by category
Billo's analysis breaks down 14 product categories. Some patterns jump out:
- Software has the worst ROAS in the dataset: 1.04. Clicks on software ads tend to come from people exploring, not purchasing.
- Baby & Toddler has the best ROAS (4.99) with the second-lowest CTR. Mothers and fathers buying products for their children don't need a flashy hook — they need trust and specificity.
- Health & Beauty is the classic trap: the market is massive, hooks work for grabbing attention, but conversions require more than a flashy clip.
This has direct implications for Q4. Black Friday is around the corner, and brands entering November optimizing for CTR are going to burn budget on clicks that don't convert.
How to adjust your strategy before Q4
If you're reading this and your dashboards show CTR as the primary metric, there are three immediate changes you can make:
1. Measure by ROAS, not CTR — and measure with the right window
CTR tells you how audiences respond to your creative. ROAS tells you whether your campaign is contributing to business goals. Use CTR as an indicator of how your creative performs, not as evidence that your campaign is commercially successful.
Also, check your attribution window. Advantage+ defaults to 7-day click + 1-day view. If you're comparing against third-party tools (Triple Whale, Northbeam), the gap between Meta-reported ROAS and real measurement can be significant.
2. Feed Advantage+ with diversity, not viral hooks
The research makes a clear pattern: categories with the best returns have ads that attract more specific audiences. Instead of creating 10 variations of the same viral hook, create 10 different angles on the product:
- UGC showing the product in real use
- Brand video with storytelling
- Statics with a specific benefit
- Founder-led content with credibility
- Educational carousels
Meta needs 15 to 20 assets per campaign for Andromeda to function properly. Diversity isn't a luxury — it's a structural requirement of the current system.
3. Separate prospecting from retargeting by channel, not by campaign
A trend we see in accounts that perform well: Advantage+ handles prospecting with diverse creative, and abandoned-cart and browse-abandonment retargeting goes back to Klaviyo or Attentive SMS.
Why? Because when Meta absorbs both functions into a single campaign, the attributed revenue gets counted twice — once in Klaviyo, once in Meta's view-through window. Separating channels gives cleaner data and better decision-making.
The question you should be asking
It's not "how do I increase my CTR?" — that's a race to the bottom where the winner spends more and earns less.
The right question is: "What percentage of my engagement metrics actually correlate with sales?"
If you don't know, you have a measurement problem that no brilliant hook is going to solve.
Billo analyzed 88,329 sales-objective Meta video ads running between January and June 2026, each generating more than 1,000 impressions. The dataset represented $122 million in advertising expenditure and $212 million in purchase value across 14 product categories. ROAS was calculated by dividing the purchase value generated by each ad by its ad spend, then averaging results within each category.
At Mintec, we manage Meta Ads campaigns for clients across multiple industries. If you want us to review how your engagement metrics compare to your actual performance, contact us.
Frequently Asked Questions
Why do the most-clicked Meta video ads generate fewer sales?
Because a high CTR attracts curious browsers, not buyers. Billo's study found Health & Beauty had the highest CTR (2.36%) but the second-worst ROAS (1.82). Clicks measure interest, not purchase intent.
What metric should I use instead of CTR to evaluate video ads?
ROAS (return on ad spend) and purchase value are the metrics that matter. CTR and hook rate are indicators of how audiences respond to creative content — not evidence that a campaign is commercially successful.
How does this affect Meta's Advantage+ campaigns?
Advantage+ needs creative diversity, not just viral hooks. Feeding the system 15-20 varied assets — UGC, brand video, statics, founder-led — gives the algorithm more data to find actual buyers, not just clickers.