

Meta CPMs Are Spiking: The Sign Flip Nobody Is Explaining and What to Do Before Q4
Meta says its average ad price rose 12% in Q2. The biggest public CPM tracker measured July 13% cheaper. Both are true — and neither tells you what your account is doing. Here is how to diagnose a CPM spike in August, the seasonal math behind it, and the three-step response we run with clients before Q4 budgets tighten.
Your Meta CPMs are probably up this month — and the official numbers are contradicting themselves. Meta reported its average ad price rose 12% year over year in Q2 earnings on July 29. But the largest public CPM tracker measured July roughly 13% cheaper. Advertisers on r/PPC are posting screenshots of $100 CPMs. All three things are simultaneously true — and none of them tells you what to do with your own account. That contradiction, and the seasonal pressure behind it, is exactly what we spend August mornings inside Ads Manager with clients. Here's how to read the signal, what actually changes costs in Q3, and the three-step response we run before Q4 budgets tighten.
The Sign Flip: why Meta says +12% and trackers say -13%
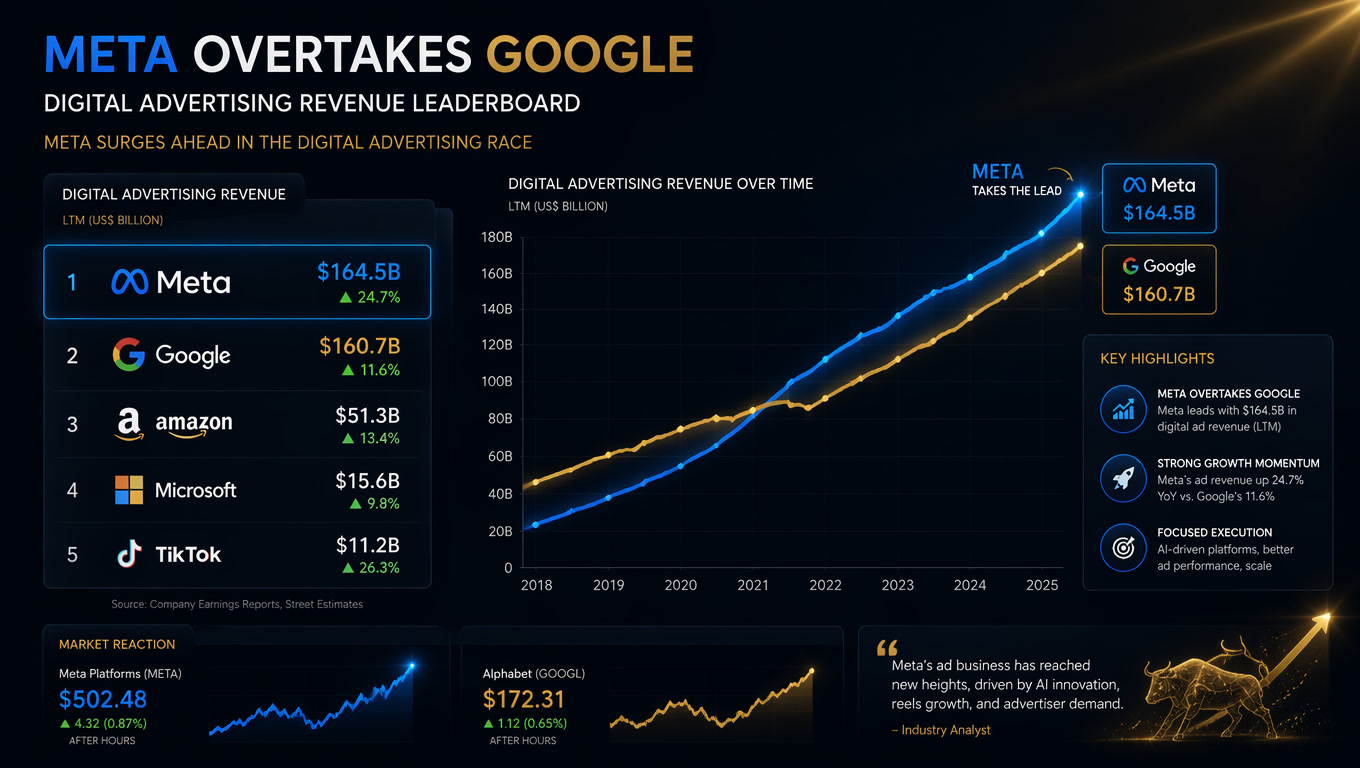
Meta's Q2 earnings call (July 29, 2026) reported average price per ad up 12% year over year. The same week, public CPM trackers were showing July prices below year-ago levels — the AdMake AI changelog that covered July 12 through August 7 flagged it as a "CPM benchmark sign flip."
Both numbers come from respectable sources. Both describe reality. They just measure different realities:
| What it measures | Meta earnings | Public CPM trackers |
|---|---|---|
| Scope | Global, every market, every advertiser class | Mostly SMB and agency accounts in developed markets |
| Metric | Revenue divided by impressions (blended price) | Bid-level CPM from sampled campaigns |
| Direction in Q2 2026 | +12% YoY | -13% in July |
| What it hides | Your vertical, your country, your account | Bigger advertisers, APAC/LATAM mix, new products |
The global number can be up while your local market is down — or vice versa. Meta's +12% reflects a global advertiser base that is spending more heavily in new surfaces and AI-assisted buying. The tracker's -13% reflects the fragmented small-account market where competition actually fell. If you plan budgets using a global average, you're planning with the wrong map.
The only baseline that answers your question is your own account: the same campaigns, same vertical, same country, over the last 90 days.
Why August is genuinely expensive
Even when the averages disagree, the seasonal calendar doesn't. Three demand forces collide in August and September:
1. Back-to-school. Education and retail-adjacent verticals see cost jumps of 15-25% in July-August, and education specifically can spike 40-50% (NinjaPromo, Ryze cost guides, 2026). Parents shopping, universities buying, retail brands launching school campaigns — the auction gets crowded.
2. Election-year political spend. 2026 is a US midterm year. Political advertising doesn't wait for November; advocacy groups and PACs start buying Q3 inventory aggressively. Political spend crowds the same auction slots your campaigns want, pushing CPMs up across verticals that never touch politics.
3. Early holiday buying. The teams that win Q4 don't start in October. They start now, so their campaigns can exit the learning phase before competition peaks. That means brands are already testing creative and scaling spend into Advantage+ — exactly when you're trying to hold your own costs down.
That's why cost guides consistently show Q4 CPMs running 40-60% above Q1-Q2 averages, with Black Friday week nearly doubling normal prices (Stackmatix, AMW, 2026). August is the warning shot. September is where the auction starts moving in earnest.
The three-step response: Measure, Isolate, Navigate
When a client comes to us complaining their Meta CPMs "suddenly doubled," nine times out of ten it's not sudden and it's not uniform. This is the framework we run:
Step 1 — Measure against your own 90-day baseline
Open the same campaigns from 90 days ago. Not the account average — the campaign-to-campaign comparison, broken down by placement. A 20% account-wide rise that's actually a 60% rise on feed and a 10% rise on Reels is a placement story, not an algorithm story. Add the Creative Similarity Score column while you're there — concentration and fatigue amplify cost spikes.
Step 2 — Isolate the cause
Ask three questions in order:
- Is it platform-wide or vertical-wide? If your competitor set shows the same movement, it's demand, not your account. Accept it and adjust expectations.
- Is it placement-driven? Compare CPMs by placement over 30 days. If a specific placement is exploding, the fix is allocation, not panic.
- Is it creative-driven? Rising CPM + falling CTR = fatigue. Rising CPM + flat CTR = auction pressure. The two need opposite treatments — refresh creative in the first case, protect budget in the second.
Step 3 — Navigate with three levers, in this order
- Shift the cheap-impression budget. If Feed is up 50% but Reels, Stories, or Threads placements are still near baseline, move a slice of budget there before touching targets. Low-CPM inventory is the first lever because it costs nothing to pull. We've covered the Threads arbitrage window in depth, and it still holds for mid-budget accounts.
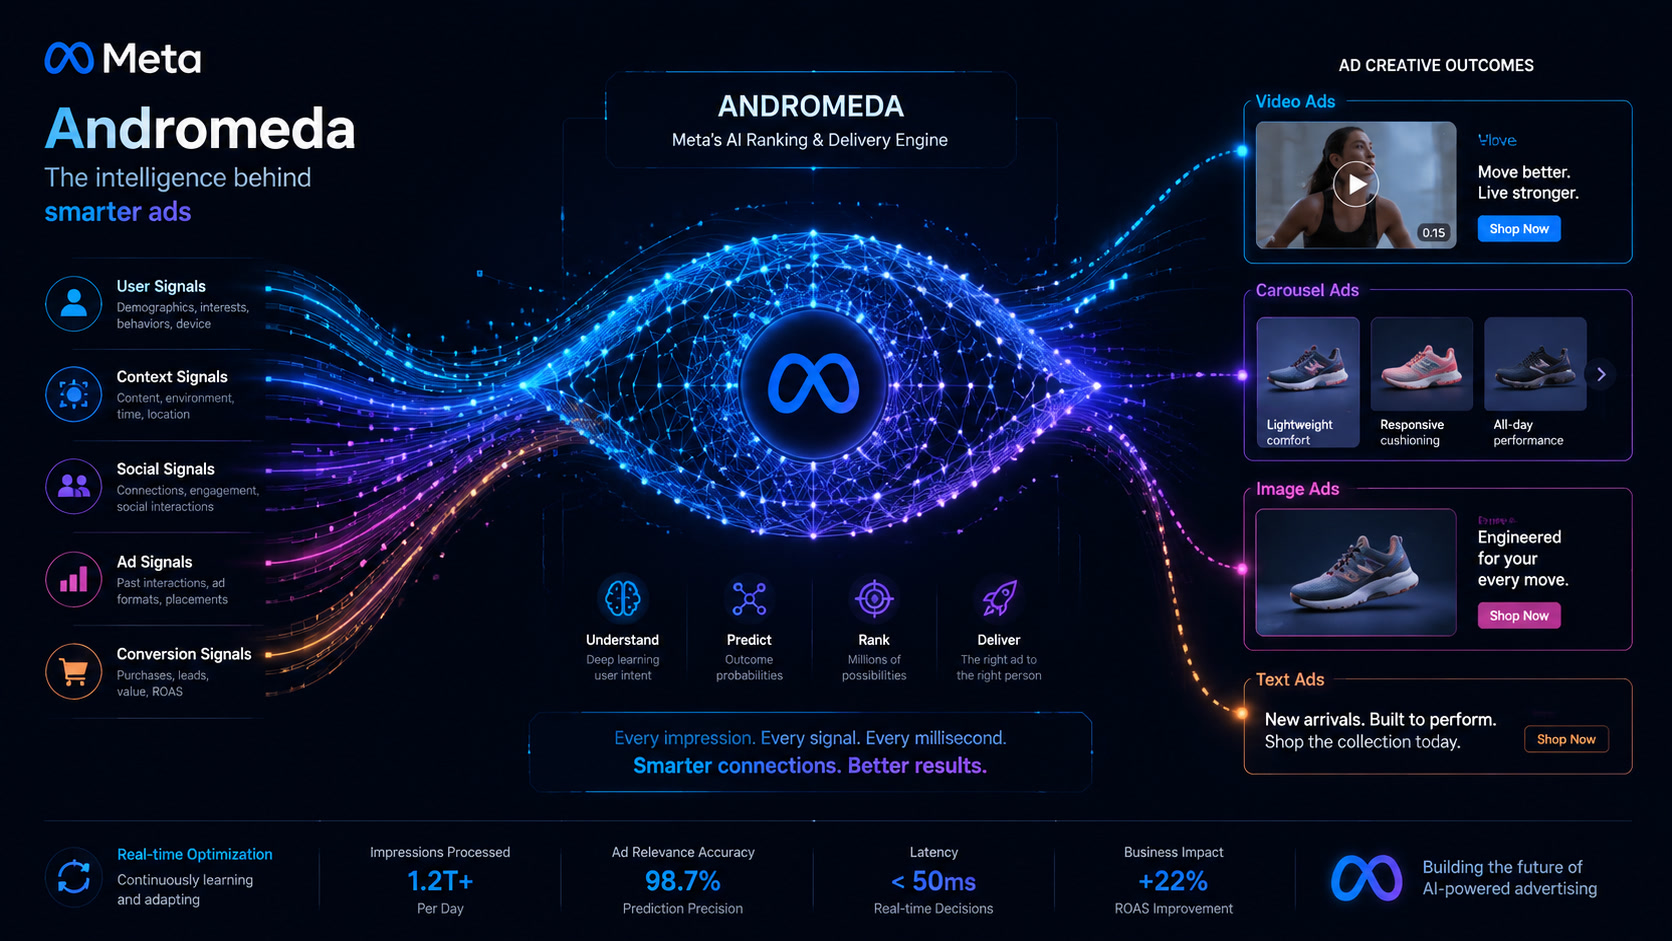
- Refresh creative before fatigue compounds. Under Andromeda, a tired creative doesn't just lose CTR — it concentrates budget and inflates CPM further. Rotate on a 7-10 day cycle with genuinely different concepts, not AI variations of the same ad.
- Only then touch targets. If costs are up 20% but your CPA math still clears margin, leave the bid alone. Cutting Target CPA in a spike is how accounts lose volume right before Q4 — the same logic that just changed for budget-limited campaigns in Google Ads, where budgets and efficiency are now separate levers. Protect volume now, optimize efficiency in the calm months.
What NOT to do in a CPM spike
- Don't panic-pause winners. The campaign that was profitable last week is still profitable; its CPM rose with the tide. Pausing starvation-style strangles the account right before the season you actually want.
- Don't cut creative volume. Fewer ads under Andromeda means less diversity, fewer Entity IDs, and worse delivery economics. The fix for expensive impressions is better creative throughput, not less.
- Don't move to cheaper objectives. Switching from purchases to clicks to save money changes the audience and the learning phase. You'll pay less per impression and more per dollar wasted.
The Q4 pre-book checklist
If you're a mid-budget advertiser ($2,000-10,000/month on Meta), lock these four things before mid-September:
- Decide the number before the auction moves. Agree Q4 CPM expectations with your CFO now, using a worst-case +40% scenario, so no one panics in November.
- Pre-test your Q4 creative now. The creative that wins a low-pressure test in August will be better positioned than the one launched fresh into the holiday auction.
- Book budget headroom. Keep 10-15% of Q4 budget unallocated for the winner's circle — the campaigns that emerge in October deserve more spend, not a flat annual budget.
- Audit placement mix monthly. CPM divergence between placements is the cheapest arbitrage left in Meta advertising. For reference points across channels, our industry cost benchmarks cover Instagram, TikTok, and Snapchat.
The bottom line
The sign flip isn't confusion — it's information. Meta's +12% and the trackers' -13% are two honest measurements of different worlds, and the seasonal calendar is heading into its most expensive quarter. The accounts that win Q4 won't be the ones with the biggest budgets. They'll be the ones that measured their own baseline, isolated the real cause of their CPM movement, and navigated with allocation and creative instead of panic.
That's what we do every morning with clients across LATAM and the US. If you want a 30-minute read on where your CPMs are going before Q4, talk to us.
Sources: Meta Q2 2026 earnings call (July 29, 2026) via AdMake AI August Changelog for Media Buyers (Aug 7, 2026). r/PPC — "Meta ads cpm are hovering at $100" (Aug 11, 2026). Seasonality data: NinjaPromo Facebook Ads Pricing Guide, Ryze Facebook Ads Cost Guide, Stackmatix Facebook Ads Cost Guide, AMW Facebook Ads Cost Guide (2026). Campaign distribution observations from Mintec-managed accounts, August 2026.
Frequently Asked Questions
Why are Meta CPMs spiking in August?
Three demand forces hit at once: back-to-school (education verticals see 40-50% cost jumps), election-year political spend ramping into Q3, and brands buying early so their Q4 campaigns leave the learning phase before holiday competition peaks. On top of the seasonal demand, Meta's own Q2 earnings reported average ad price up 12% year over year.
Why does Meta say prices rose 12% while public CPM trackers show them cheaper?
They measure different things. Meta's average price per ad is a global revenue-per-impression blend across every advertiser and country. Public trackers sample mostly small-business and agency accounts in specific markets. Neither number is wrong — and neither reflects your vertical. The only baseline that matters is your own account data over the last 90 days.
What should I do if my Meta CPMs are rising right now?
Don't panic-pause winners or cut bid targets blindly. Measure your 90-day baseline, isolate whether the jump is account-wide or campaign-specific, then act: shift cheap-impression budget to lower-CPM placements, refresh creative before fatigue compounds, and protect Q4 by locking budgets and testing early.